4.2.2 Acquired or derived data
Acquired data are all data collected during the study for the sole purpose of the analysis.
Derived data are obtained by transforming raw data into more directly usable data through, for instance: data fusion, filtering, classification, and reduction. They typically contain derived measures (such as, for instance, time-headway, which derives from both longitudinal speed and headway), and performance indicators (PI), referring to time- and location-based segments such as particular events.
In most cases, transforming acquired measures into derived measures during pre-processing or processing doesn’t change their nature, established that no information loss occurred. For instance, an acceleration low-pass-filtered to remove noise doesn’t cease to be a vehicle-dynamics measure; the depression of a pedal converted to a discrete pressed/not-pressed state doesn’t cease to be a driver-action measure. As a result, in most cases, the subclasses presented below apply to both acquired and derived data.
However, in some cases, several kinds of measures are combined to form new, more interpretable measures, which can’t be categorized simply. For instance, speed and acceleration from several vehicles can be combined to form a time-to-collision variable.
This category includes both objective data, in the form of measures from sensors (referred to as sensor data in FESTA), and subjective data, collected from either the participants (referred to as self-reported measures in FESTA) or analysts. Subjective data can be as varied as time-history data, subjective classification of time segments, or rich-text information from travel diaries, interviews, and focus group discussions. Questionnaires can alsobe seen as acquired data when collected periodically during the project (compared to the static questionnaire data described in 4.2.1).
In this section a structure of the sub-classes is described below and presented inFigure 6.
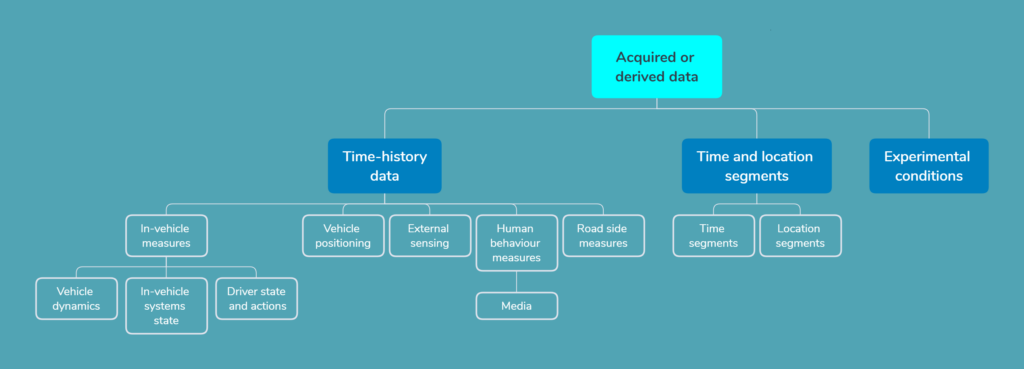
Figure 6: Subclasses of Acquired or derived data
Time-history data (parent: Acquired or derived data)
Time-history data describe the history of a measurement over time. Time-history data can be collected with a specific measurement frequency, or when triggered by an event, typically a value change.
Time-history data may consist of the variation over time of single physical values (e.g., speed), a collection of physical values (e.g., 3-axis acceleration) or more complex media, such as sound or video.
Time-history data can either be collected from the vehicle perspective, by means of (for instance) an instrumented vehicle, smart device application or travel diary, or from the infrastructure perspective, by means of roadside measurements. They can be historical or real-time observations, or by measurements done in a mobile phone app from persons inside or outside of a vehicle.
Time-history data consist of both direct measures, i.e., raw data measured over time, or derived measures, after any kind of transformation (such as resampling, offset correction, filtering, and removal of incorrect values) has been performed.
In-vehicle measures (Time-history data)
Instrumenting vehicles enables the collection of vast amounts of data, using either original sensors (tapping their communication networks, such as CAN) or additional sensors. Applications on smart devices (i.e., smartphones) can also collect important information in the following categories, and the data they collect can basically be treated the same way as the data from instrumented vehicles.
Vehicle dynamics (In-vehicle measures)
Vehicle-dynamics measurements describe the motion of the vehicle. Typical measurements are longitudinal speed, longitudinal and lateral acceleration, yaw rate and slip angle.
In-vehicle systems state (In-vehicle measures)
The state of in-vehicle systems can be accessed by connecting to the embedded controllers. The data category comprises continuous measures, like engine speed, or categorical values, like ADAS and active safety systems activation, and automation level.
It is important to document the system state when in baseline mode. As new vehicles have numerous active systems installed, there is a need to know the settings also for baseline data. The AD-level (SAE J3016, 2018) is important both for baseline and treatment data when comparing an autonomous function in level 4 in treatment and in level 1 for the baseline data.
Driver state and actions (In-vehicle measures)
In addition to variables describing driver actions which command the vehicle, like steering wheel angle, pedal activation or HMI button press, variables characterizing the physical and emotional state of the driver can also be measured. For instance, cameras and computer vision can measure driver position, detect engagement in a secondary task or detect eyelid closure (which highly correlates with alertness). In fully autonomous vehicles (e.g., a shuttle) the driver might be a remote operator having the responsibility to act in the case of problems that the AD-system cannot solve. The actions are of course important to record, in the vehicle but also in the remote operator system.
Vehicle positioning (Time-history data)
The geographical location of a vehicle is most frequently determined with global navigation satellite systems (GNSS) and the aforementioned advanced sensors. It can also be determined by information from the cell phone network, surrounding Wi-Fi networks, or a combination of these and GNSS.
External sensing (Time-history data)
A precise understanding of the environment can be obtained by advanced sensors like radars, LIDARs, cameras, and computer vision, or by simpler sensors (e.g., optical or temperature).
It is imperative to detect different objects around the (ego vehicle), including their position, heading, speed and size. Depending on the need of a project, the output of some of these sensors could be stored for assessing the ground truth. Raw high-resolution video or point-clouds can consume vast amount of storage.
Some signals could be logged from the in-vehicle data network. For instance, luminosity (indicating the presence of rain), characteristics and dynamics of the infrastructure (e.g., lane width, road curvature) and surrounding objects (e.g., type, relative distance, and speed) can all be measured from within a vehicle.
Human behaviour measures (Time-history data)
The actions of drivers can be measured from the vehicle perspective but also there is with the introduction of AD function also a need to view the driver as a passenger and also to understand the whereabouts of other passengers. In some cases, you can collect objective data from sensors in the vehicle or devices attached to a mobile app (e.g., a device measuring heart rate and transferring this to a mobile app).
Complementary to sensors and instrumentation, some continuous measures can also be built through the perception of analysts or annotators using video data. Eye glance and driver state (e.g., drowsy, impaired, angry) can be evaluated manually by analysing video from driver-face-oriented cameras. This is even more important in the context of autonomous vehicles, where rich data from video could automatically be converted into individual measures of interest (e.g., hands on steering wheel, head and body pose).
Media (Human behaviour measures)
Media data are usually video, but in some data-collection projects audio is recorded. The image or video data are used to give a ground truth of the persons inside the vehicle, to understand their behaviour and response to external factors.
Roadside measures (Time-history data)
Roadside measures comprise vehicle counting, speed measurement and positioning – using radar, LIDAR or simpler rangefinders, video-based counting, inductive loops or pressure hose.
In the case of ITS systems, they may also contain more complex information remotely transferred from vehicles to or from roadside units. These messages are given more attention in an autonomous driving scenario where vehicles could communicate with each other to warn or inform. One challenge is to have a common time reference on timestamps both when the message was transmitted and received at the sender and receiver.
Media data (typically video – for instance in traffic conflict observations) are also often collected from beside or above the roadside. Roadside measures are evolving rapidly, with data being collected by drones or open-data services, for example.
Experimental conditions (Acquired or derived data)
Experimental conditions are the external factors which may have an impact on participants’ behaviour. They may be directly collected during the experiment or integrated from external sources. Typical examples are traffic density and weather conditions. Controlled factors, such as the ability to use a system, also need to be included in the dataset, depending on which phase of the experimental plan a participant is currently participating in.
Time and location segments (Acquired or derived data)
For the purpose of the analysis, it can be relevant to analyse the data aggregated for a delimited period in time or space (such as journeys, certain events as defined in FESTA or e.g. road segments). These data segments are defined by a combination of specific conditions and characterised by specific attributes, some which are automatically computed, and some which are manually annotated from video. The attributes mostly consist of situational variables and/or PI, depending on the studied phenomena and its expected contributing factors; they can also consist of links to other segments or contextual data. For instance, each trip might link to a specific driver and vehicle, each of which have their own characteristics. Finally, the segments might serve as a container for time-history data: a trip can contain the history of the vehicle speed and an event may contain successive eye-glance values, manually coded by an annotator. As a result, the segments contain a large amount of initial data, which is structured, reduced, and summarized into more manageable tables, suitable for data analysis.
The creation of the segments can either be automated (i.e., they are created in response to a specific value or threshold of one or more variables), manual (when a specific event is observed on a video), or a combination of both (e.g., automatic detection of candidate events, accepted or rejected in video annotation). In the same way, attribute values can either be automatically computed (i.e., the mean or maximum value of a measure during a time segment) or manually annotated, typically from video. In the latter case, standardized annotation schemas are used to enrich data with information available from video recording. Annotation variables are thus a subjective assessment of the situation by an analyst or annotator. They can be quantitative, using single or multiple choices (i.e., present/not present or level of rain); they can consist of specific time stamps, for example when the driver is first aware of a hazard; or they can be qualitative narratives, which describe a specific event or situation.
Finally, subjective, participant-reported data can be collectedas certain kinds of segments, such as self-declared events, or they can populate some segment attributes (e.g., travel diaries that contribute some characteristics to trips).
Time segments (Time and location segments)
Time segments are the most common type of segments, collected and/or generated during data reduction. They correspond to a time period when some specific conditions are met. Depending on the kind of conditions which define them, their typical duration, and the researcher’s own vocabulary, they are identified as trips (a vehicle is started, driven for a period of time by a driver, then stopped), events (typically a short period of time with very particular characteristics), situations or chunks (division of the complete dataset into segments of comparable size according to a combination of situational variables, characterized with PI).
Locations (Time and location segments)
While time segments take the perspective of a driver in a vehicle during a trip, locations take the perspective of a place, where multiple trips might pass through. Roadside observations will typically generate locations, and typical location attributes are vehicle counts or speed measurements, which can also be associated with the infrastructure attributes. Furthermore, using geographical information systems (GIS), data from in-vehicle collection can also be projected over a geographical reference system to characterize, for instance, one or several participating drivers’ behaviour at a specific location such as an intersection. Just like trips, locations can be divided into smaller segments. This could be parts of a road stretch, especially when a fixed trajectory is followed. The segments can be used individually or be linked in a chain.